Portfolio Visualizer
While I've written about my use of M1 and Betterment - and provided a high-level overview of what can be done, I have also been looking for ways to improve - including managing risk
A great site you should consider is PortfolioVisualizer. It is a nice suite of tools that allow you to backtest various scenarios as well as run optimizations, backtests and simulations. Although my personally-saved portfolios can not be viewed directly, you can see one-such strategy I've been toying with here.
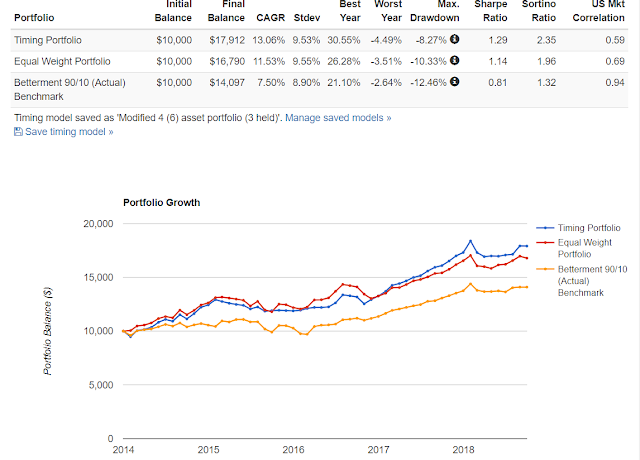
Here's a quick snapshot of what I've come up with:
The Hypothetical System:
The Timing Portfolio consists of four ETFs:
BND BNDX VTI VXUS UPRO TMF
In this strategy, at the end of every month I look back over the prior 5 months and pick the 3 best performers and weight according to inverse volatility. It may be the same ETF selection for a few months with different weightings. It may be all selections from the list of ETFs.
Every month you end up with a maximum of 6 transactions - 3 Buy / 3 Sell. In a small portfolio this could become an expensive drag on performance over time when you consider fees. But - this type of portfolio may work on M1 quite well. Since there are no transaction fees, you can eliminate most of this drag and just adjust your pie every month.
It is also important to note that the graphics above assume purchase at month-end close prices. If you were to pursue something similar to this on M1 - M1 makes purchases during the opening window of the day (starts at 9AM and runs until all transactions are completed). That timing difference may have a significant impact on performance over time. If, and I wish this could happen, M1 opened a second trading window to purchase at close, it could narrow drift in this kind of portfolio.
For comparison, I took my existing Betterment portfolio (~90% stock / 10% bonds) and used it as a benchmark.
You'll noticed the annualized volatility has increased ~.63% but we see a significant Alpha premium of ~8%. If you look back to the prior screenshot, you'll notice a CAGR 13.06% vs the Betterment portfolio's 7.5%. A significant improvement for adding a little additional risk. But you also end up with a significantly lower correlation to US markets.
For comparison, here's the same portfolio up against the S&P 500 (Vanguard Index Investor shares)
Over this same period, you have very similar performance (with a slight outperforming) of the S&P 500.
Other considerations
The thing to consider with doing something like this is that the ETF portfolio I'm testing with only goes back over 5 years of history. This is, generally speaking, a narrow window of time. I'm going to see if I can synthesize these funds into mutual funds to look back over a longer period of time (which may be difficult with the leveraged funds being in the mix).
This is not, and I must stress, NOT a market beating portfolio on an annual basis - especially in the short term. In the short term you may find the volatility of the portfolio is higher than that of whatever underlying benchmark you choose. The downside here is that if you commit to doing something like this, it has to be over a long period of time - something many investors find difficult. This isn't, and will never be, a short-term portfolio. If you find you change funds as frequently as you change underwear, while chasing returns, you should probably move on.
Also - the more knowledgeable may disagree - this is also a case where I'm using leveraged ETFs in a reasonable manner. Most people will tell you that leveraged ETFs are not buy and hold material - or even worth holding ever. This should show you that holding them and using them within a system can improve returns with reasonable risk.
This strategy is also risky in that you might have periods of significant equity or significant bond exposure (with a regular fund and leveraged fund). I'll also add there are periods where no leveraged funds were used at all.
And finally, it may be superstition, but I've found the tool returns better results using Fibonacci numbers - For example, using a 5 month look back and weighting on 3 month inverse volatility. Maybe I'm crazy.


Comments
Post a Comment